Risk Aversion
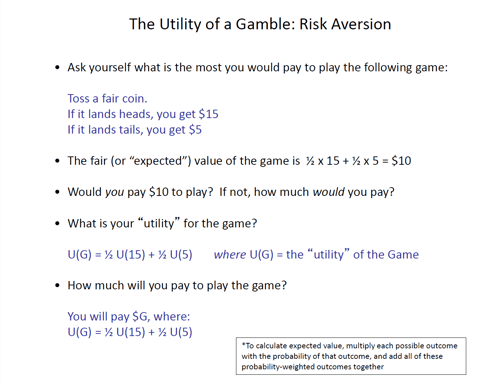

In our little game, let's reflect on what truly makes us happy and our desire for more money. Imagine participating in a simple game where you flip a fair coin: if it lands on heads, you win $15; if it lands on tails, you win only $5. The question is: how much would you be willing to pay to play this game? By doing the math, the expected value of the game is calculated by considering the probabilities of each outcome. Since the probability of getting $15 (heads) is 50%, while the probability of getting $5 (tails) is also 50%, the expected value is $10. This simple game encourages us to think about how much value we place on risk and financial reward in our pursuit of happiness.
When evaluating the game based on the probability of obtaining a result, the possibility of getting a $5 is crucial, as it represents half of the possible outcomes. By multiplying each outcome by its probability and summing up all the products, we arrive at an expected value of $10 for each round of the game. This concept becomes clearer when we ask ourselves what we can expect after playing 100 times. On average, we can predict reaching a total close to $1,000, which is equivalent to 100 times the expected value of $10. Therefore, the expected value not only provides an indication of the winnings for a single round but also gives a long-term perspective on the expected earnings in the game.
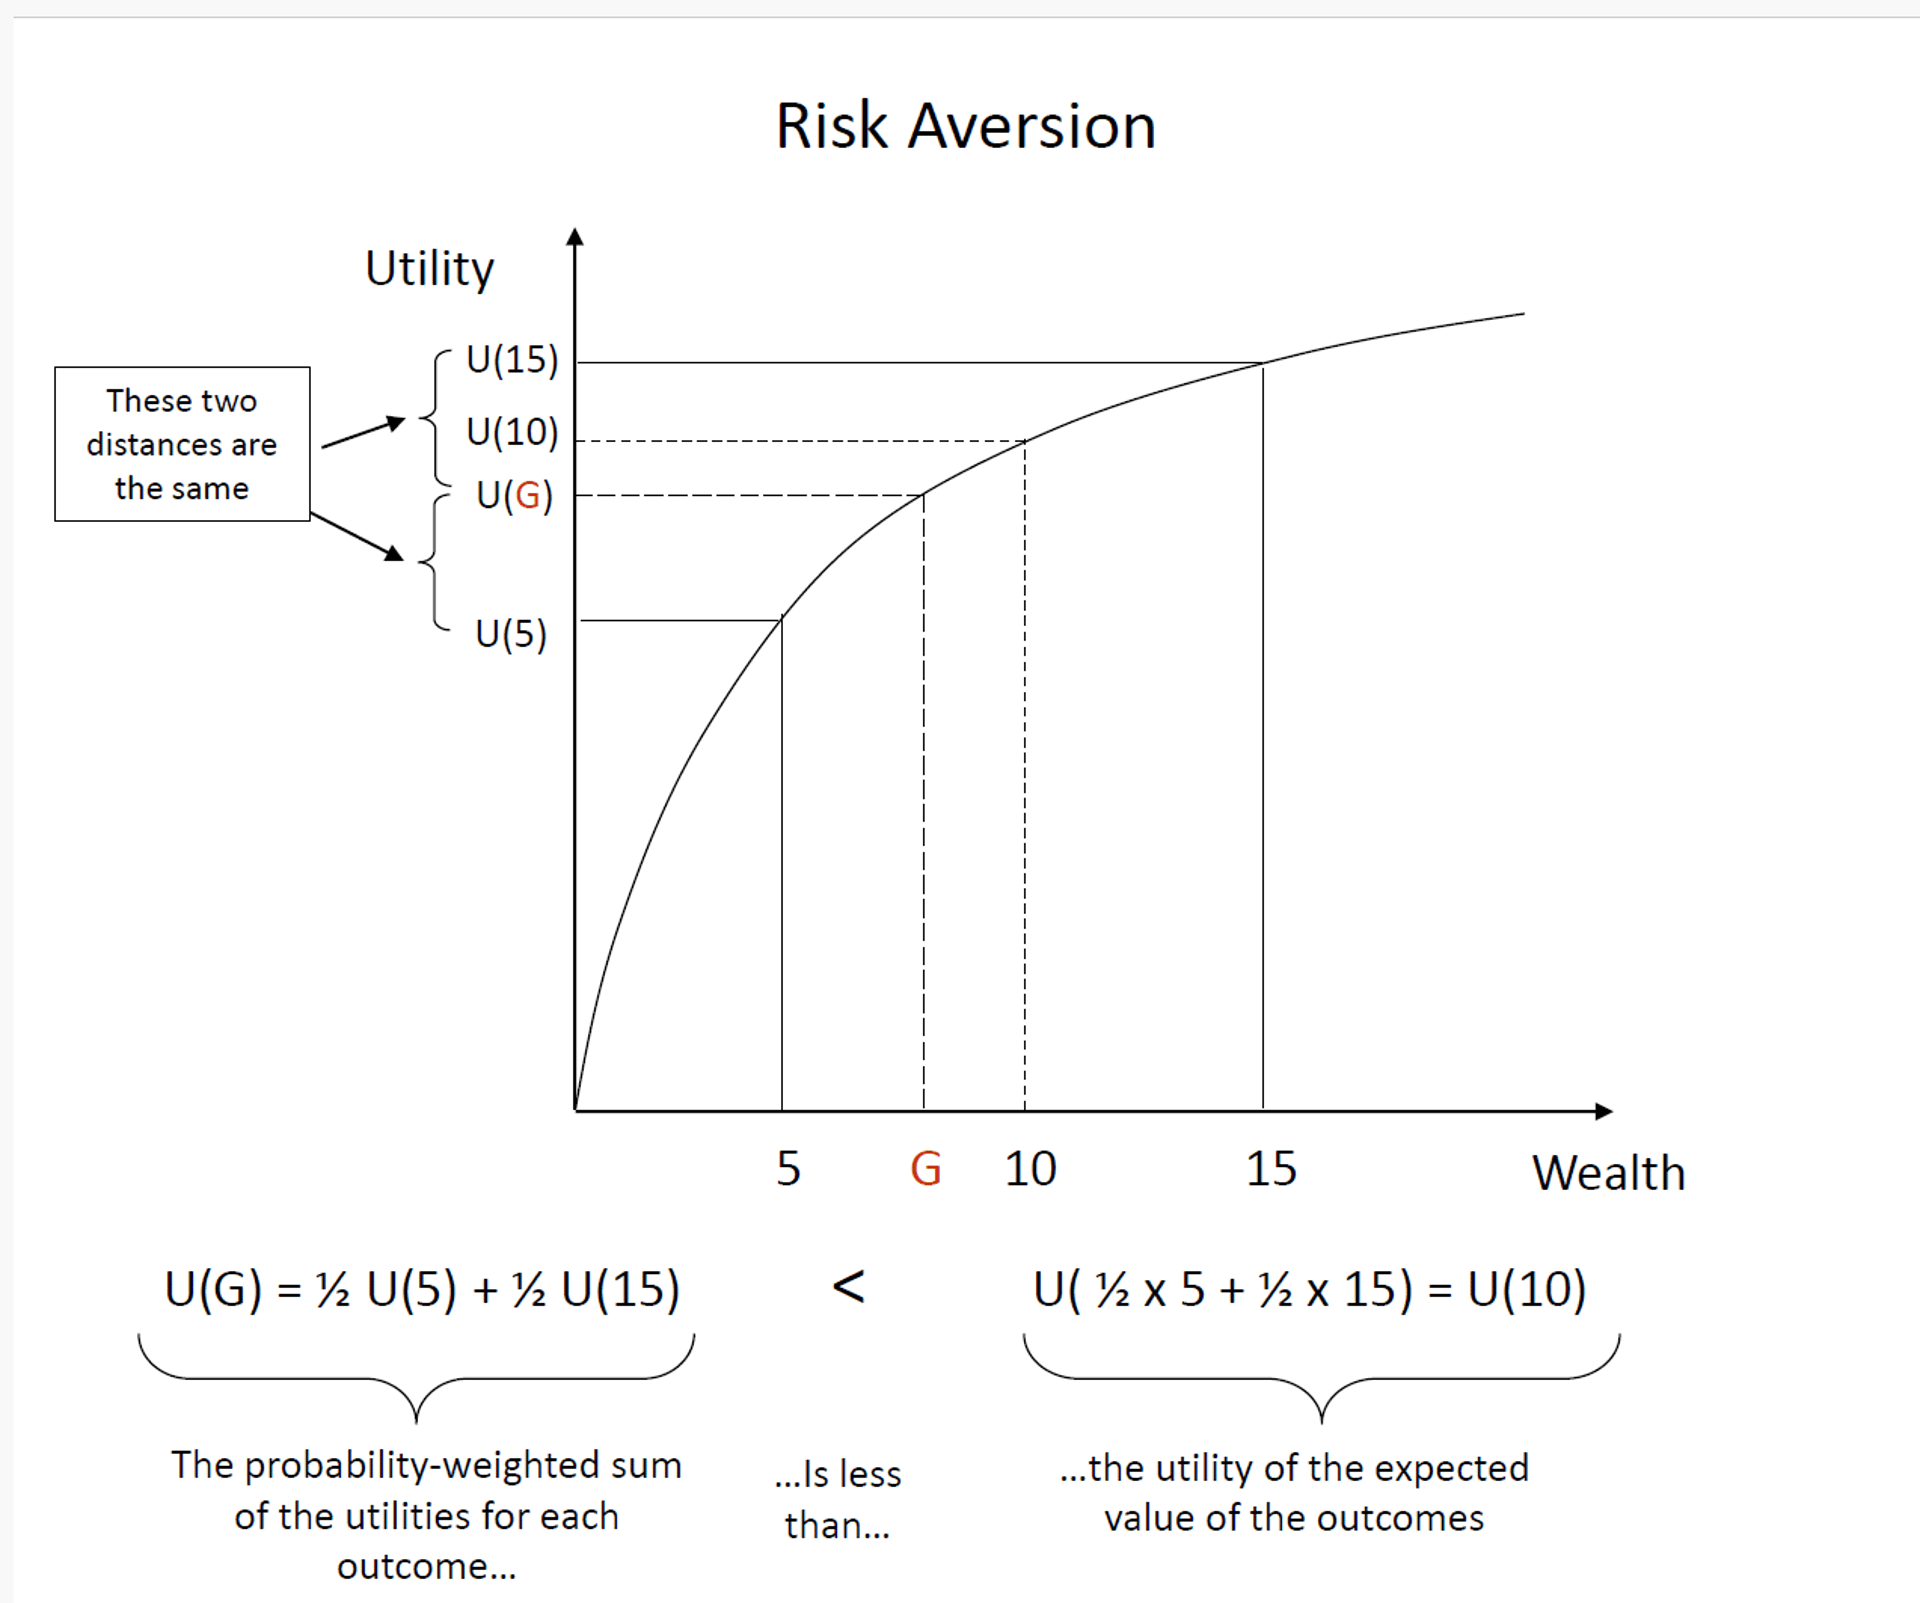
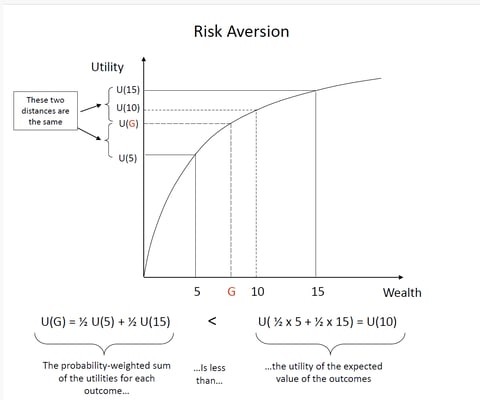
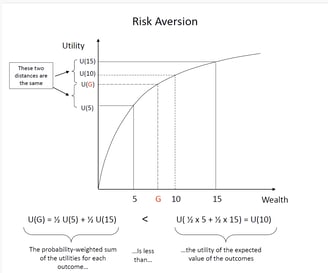
In the context of our risk aversion graph, let's examine the points represented by $5 and $15 on the horizontal axis. It's important to observe where these values fall on the vertical axis and, in particular, to note the difference between the utility of $15 (u(15)) and that of $5 (u(5)). The interval between these two utilities is significantly smaller than the distance between $5 and $15 on the horizontal axis. This phenomenon aligns with the fundamental concept that each incremental dollar loses some of its value in terms of happiness or utility. Therefore, we can delve into this relationship from a mathematical perspective to better understand the impact of financial choices on our perceptions of satisfaction.
Analyzing the utility of a gain highlights a fundamental aspect of risk aversion. Looking at the lower part of the slide, we notice that our utility for a gain is equal to half the utility of 5, plus half the utility of 15. When we observe the vertical axis, we can see that the utility of the gain is lower than the utility of the expected value of the gain, represented by u(10). This phenomenon clearly illustrates how our perception of individual outcomes is less favorable compared to what we might expect when considering the combination of such outcomes. In other words, risk aversion manifests in how we process and evaluate economic outcomes, leading us to prefer certainty over potentially higher but uncertain returns.
Behavioral finance offers a fascinating perspective on how people's economic decisions are influenced by psychological and cognitive factors. Contrary to the idea that individuals are always risk-averse, we often observe that their reactions vary depending on the circumstances and emotions of the moment. Additionally, probability estimates are never precise: people tend to overestimate rare events and underestimate more common ones. These predictable errors can lead to suboptimal choices that affect their finances and investments. By analyzing these behaviors, we can better understand market dynamics and improve investment strategies. Awareness of such behaviors allows us to make more informed and rational decisions in the financial landscape.
Blog P.I.
The information provided on this blog is for general informational and educational purposes only, and is not a substitute for professional advice, diagnosis or treatment from a qualified healthcare provider, psychologist, financial advisor, or other expert.
The health and wellness information provided on this blog is not intended to be a substitute for professional medical advice, diagnosis, or treatment. Always seek the advice of your physician or other qualified health provider with any questions you may have regarding a medical condition.
The financial information provided on this blog is not intended to be personal financial advice. Any financial decisions should be made based on your specific circumstances, after consultation with a qualified financial advisor.
The psychological information provided on this blog is not a substitute for therapy or counseling. If you are experiencing emotional or behavioral difficulties, please seek help from a qualified mental health professional.
The author of this blog assumes no responsibility for errors or omissions in the content thereof. The information on this blog is provided "as is" without warranty of any kind.
This blog may contain links to external websites. The author has no control over the content of these sites and assumes no responsibility for them.
The information on this blog is subject to change without notice.
All content on this blog is protected by copyright. Reproduction, distribution, or publication of any content on this blog is prohibited without the express written consent of the author.
© 2025-2026. All rights reserved.
If you have any ideas or suggestions...: piersnoopy@gmail.com